Auto insurance in Lubbock, Texas, requires coverage for all vehicle owners (just like the rest of Texas). Of course, you want the insurance carrier to repay you in case your vehicle is stolen or damaged in a mishap. Lots of people tend to grumble about the high costs of auto insurance in Lubbock, and the average coverage elsewhere. Here, we offer you some quick tips with the help of which you can get the best car insurance price estimates. (Keep reading for Traffic Crash Facts Infographic)
You need affordable auto insurance in Lubbock, and statewide, whether you’re a new vehicle owner or your previous car insurance policy needs a renewal. You may be shocked that different insurance company uses different premium rates for the same protection. Therefore, it is in your interest to seek a low premium for coverage on your car insurance plan. Local market search through your local, independent insurance agent is the smart option. Your local insurance agency has the expert knowledge to find you the best vehicle insurance quotes.
Needed Info
While searching for auto insurance Lubbock quotes, the insurance agent will need your info such as your name, age, postal code, address, your marital status, car’s annual traveling miles and safety functions of your car. They need this information in order to match you with the best auto insurance options.
Your credit rating matters to auto insurance companies. Evaluations of insurance providers reveal a connection between credit report and risk to an insurance company. Therefore, your credit rating can have an effect when shopping for car and truck insurance quotes.
When looking for an auto insurance quote, ask about discounts offered by insurance carriers. Bundled insurance or other discount incentives can get you a lower premium. If you have a life insurance policy or health insurance policy or any other insurance coverage, it is advised to ask the very same insurance provider for automobile insurance coverage. They will most likely provide lower vehicle insurance quotes since you are already their client.
By following these suggestions, you can make certain that you will have the ability to buy the best car insurance coverage for your needs.
Auto Insurance Facts and Interesting Statistics
– Automobile Insurance facts via Visual.ly
- ALL 50 STATES REQUIRE DRIVERS TO CARRY CAR INSURANCE
- SPEED LIMIT 3X – 16-19 year old drivers are 3 TIMES more likely to have speeding violations.
- 17.9 YEARS – On average a driver will have an accident claim once every 17.9 years.
- (PIP) – Medical Payments or Personal Injury Protection (PIP)
- This coverage pays for the treatment of injuries to the driver and passengers of they policyholder’s car.
- 7 Most Common Auto Insurance Claims
-
- Fender Benders
- Theft
- Whiplash
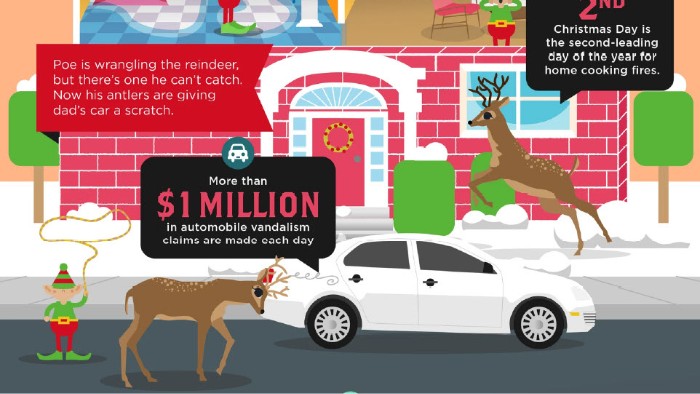
- Vandalism
- Windshield Damage
- Back Injuries
- Animal Collisions
-
- 25 YEARS OLD – Auto premiums usually go down substantially after a driver turns 25.
Reason: 28% of all fatality victims are younger than 25 years of age. - TOP 5 most expensive & least expensive states for auto insurance
MOST- Michigan
- Louisiana
- Kentucky
- West Virginia
- Mississippi
LEAST
- Massachusetts
- North Carolina
- Hawaii
- Alaska
- Oregon
- RED CARS! – It’s a myth that the color of your car affects the price of your car insurance. PICK ANY COLOR
- STOP – Read your auto policy. Talk to your Local Independent Insurance Agent to make sure you know your coverage.
- 55 vs. 9: 55 out of every 100,000 registered motorcycles was involved in a fatal crash, compared with only 9 out of every 100,000 passenger cars.
- Uninsured – About 16% of drivers are uninsured at any given time.
- THEFT – Your car insurance may NOT cover theft of items from inside your car. Check with your local, independent insurance agent.
- Seat belts – Only 84% of people use seat belts
- USED – Insuring a pre-owned car can save you up to HALF on your premium.
- Average Loss Per Claim:
- $3800 – SUV
- $4200 – CAR
- $4400 – TRUCK
Interesting Auto Crash Stats
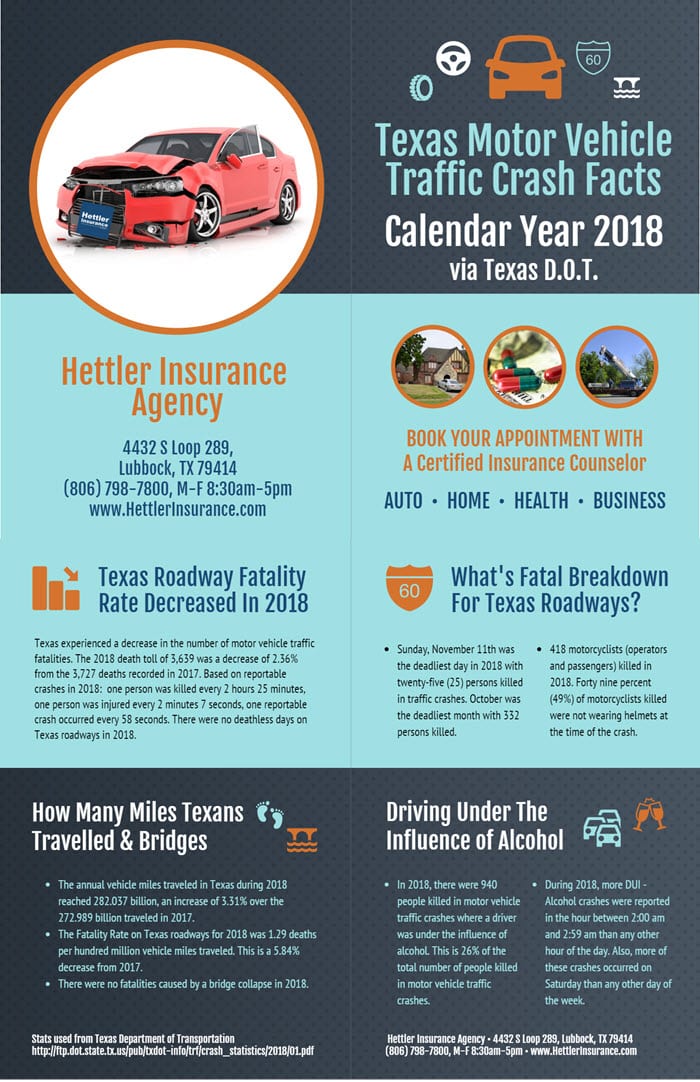
Texas Motor Vehicle Traffic Crash Facts, Calendar Year 2018, via Texas Department of Transportation
- Texas roadway overall fatality rate decreased in 2018.
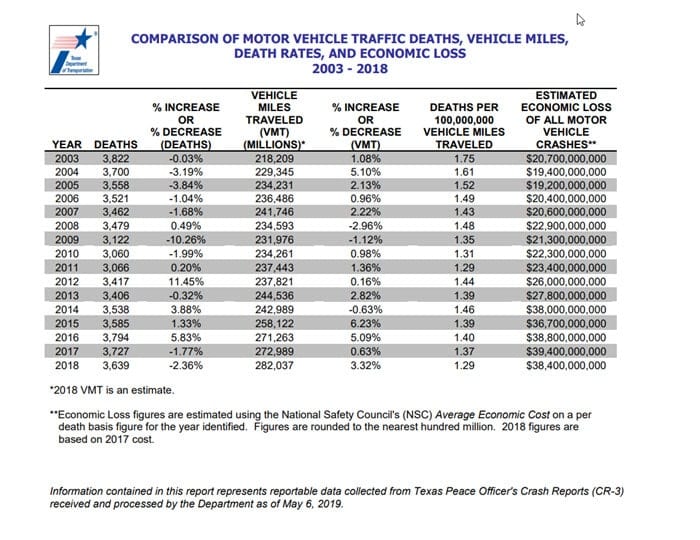
- Texas experienced a decrease in the number of motor vehicle traffic fatalities. The 2018 death toll of 3,639 was a decrease of 2.36% from the 3,727 deaths recorded in 2017.
- Based on reportable crashes in 2018:
- 1 person was killed every 2 hours 25 minutes
- 1 person was injured every 2 minutes 7 seconds
- 1 reportable crash occurred every 58 seconds
- No crashes that resulted in 6 or more fatalities in 2018.
- No deathless days on Texas roadways in 2018.
- In 2018, there were 398 people killed in crashes involving distracted driving. This is a 12% decrease from 2017.
- What’s the fatal breakdown for Texas Roadways?
- Sunday, November 11th was the deadliest day in 2018 with twenty-five (25) persons killed in traffic crashes. October was the deadliest month with 332 persons killed.
- 418 motorcyclists (operators and passengers) killed in 2018. Forty nine percent (49%) of motorcyclists killed were not wearing helmets at the time of the crash.
- Fatalities in traffic crashes in rural areas of the state accounted for 54.99% of the state’s traffic fatalities. There were 2,001 deaths in rural traffic crashes.
- Single vehicle, run-off the road crashes resulted in 1,289 deaths in 2018. This was 35.42% of all motor vehicle traffic deaths in 2018.
- In 2018 there were 701 people killed in crashes occurring in intersections or related to an intersection.
- There were 548 people killed in head-on crashes in 2018.
- Of all persons killed in vehicles where restraint usage was applicable and usage was known in 2018, 43.06% were reported as not restrained when the fatal crash occurred.
- How many miles Texans travelled & bridge collapse
- The annual vehicle miles traveled in Texas during 2018 reached 282.037 billion, an increase of 3.31% over the 272.989 billion traveled in 2017.
- The Fatality Rate on Texas roadways for 2018 was 1.29 deaths per hundred million vehicle miles traveled. This is a 5.84% decrease from 2017.
- There were no fatalities caused by a bridge collapse in 2018.
- Driving under the influence of alcohol
- In 2018, there were 940 people killed in motor vehicle traffic crashes where a driver was under the influence of alcohol. This is 26% of the total number of people killed in motor vehicle traffic crashes.
- During 2018, more DUI – Alcohol crashes were reported in the hour between 2:00 am and 2:59 am than any other hour of the day. Also, more of these crashes occurred on Saturday than any other day of the week.
- What about walking and cycling?
- Pedestrian fatalities totaled 621 in 2018. This is a 0.98% increase from 2017.
- Pedalcyclist fatalities totaled 72 in 2018. This is a 26.32% increase from 2017.
- Non-fatal injuries
- There were 12,161 serious injury crashes in Texas in 2018 with 14,908 people sustaining a serious injury *.
- 249,241 persons were injured in motor vehicle traffic crashes in 2018.
* Effective with the 2010 Annual Summary reports, the definition of “Serious Injury” was changed to only include “Incapacitating Injury”. Therefore, Serious Injury data cannot be compared to prior years. Information contained in this report represents reportable data collected from Texas Peace Officer’s Crash Reports (CR-3) received and processed by the Department as of May 06, 2019.

Texas Traffic Death Economics, What’s The Cost Of Traffic Incidents | via Texas Department of Transportation
-- Life Insurance Instant Quote and Apply Tool @ GetLifePolicy.com > * Quick self-service term life insurance quote. With or without medical exam.
-- Call us about Auto, Home, Business, Life, or Health insurance. * Click to Call (806) 798-7800, Mon-Fri 8:30am-5pm (lunch closed Noon-1pm)
-- Come see us @ our new address 4720 S Loop 289 Lubbock, TX 79414 (maps link), or get your online quote started at https://GetHettler.com


